ASCE INFRASTRUCTURE REPORT CARD

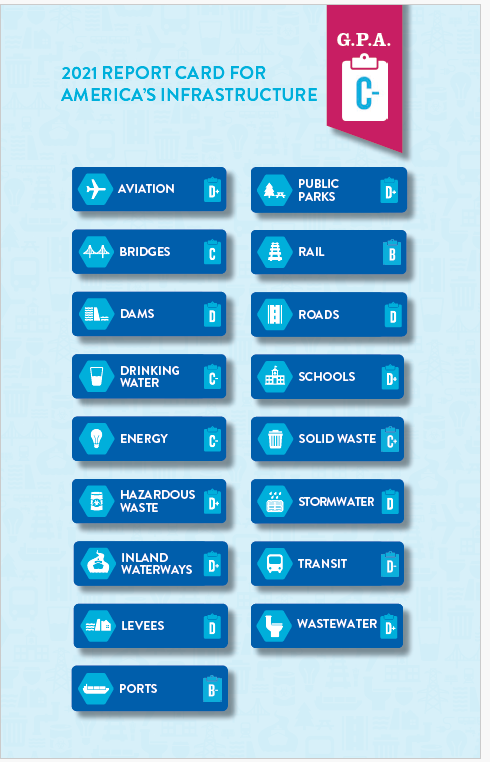
Read ASCE's Full 2021 Report HERE!

Read ASCE's 2021 Summary Report HERE!

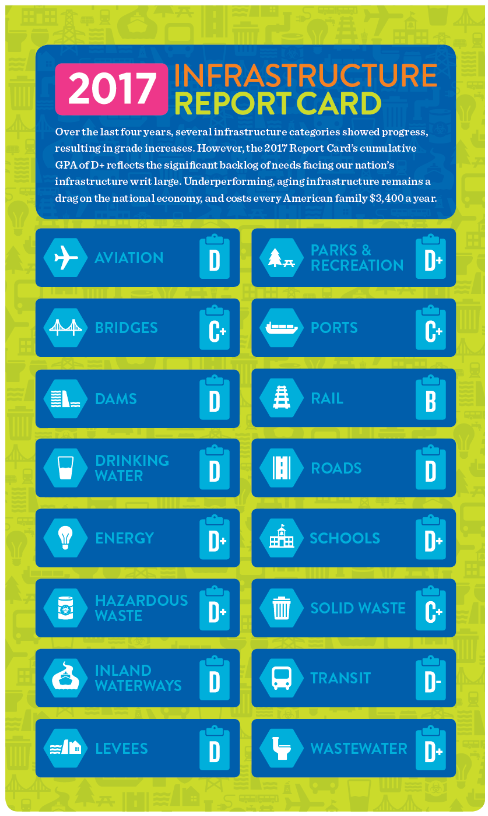
Read ASCE's Full 2017 Report HERE!

Read ASCE's 2019 Report Card for Kentucky


Please note that Chapter 1 of the Text refers to the
2017 ASCE Infrastructure Report Card. In 2021,
ASCE once again updated this work,
ASCE's practice since ASCE introduced the
Infrastructure Report Card in 1998.

I am providing these links to the
2021 and 2017 Reports for those who are
interested in assessing progress since 2017.

I find the following excerpts from the
2021 Summary Report instructive in this regard.

"The 2021 grades range from a B in rail to a D- in transit. Five category grades — aviation, drinking
water, energy, inland waterways, and ports — went up, while just one category — bridges — went
down. And stormwater infrastructure received its first grade: a disappointing D. Overall, eleven
category grades were stuck in the D range, ..."
at Page 2.

"... there are three trends worth noting:

1. Maintenance backlogs continue to be an issue, but asset management helps prioritize
limited funding.

2. State and local governments have made progress. Increased federal investment or reform has
also positively impacted certain categories.

3. There are still infrastructure sectors where data is scarce or unreliable." at Page 2-3.

"For the first time in 20 years, our infrastructure GPA is a C-, up from a D+ in 2017." at Page 3.


How Big ($$$$) Is Our Infratructure Problem?
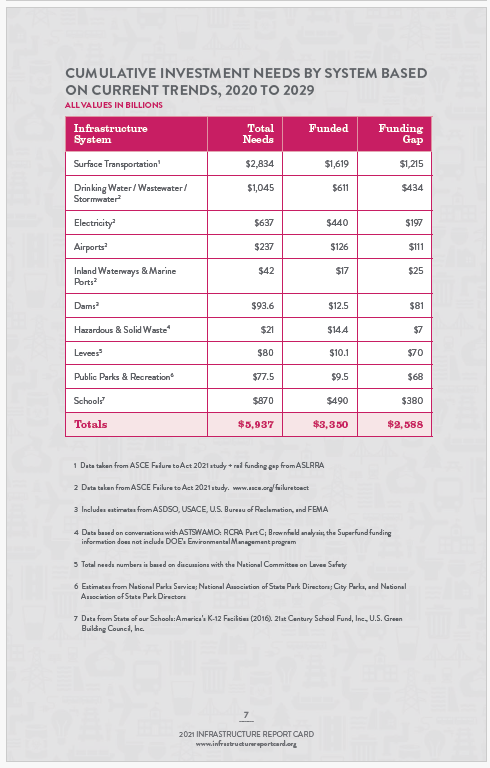
$2,588 Trillion

ASCE recommends increased infrasture spending immediately, from about 2.5% of GDP to about 3.5% of GDP


To Return to this page after visiting any of the above external links ,
use the "Back" button on your browser.


To Return To Home Page