2004-05 At A Glance
Dark Blue: Average Offensive Efficiency For Season
Pink: Average Defensive Efficiency For Season
Yellow: Five Game Moving Average Offensive Efficiency For Season
Light Blue: Five Game Moving Average Defensive Efficiency For Season
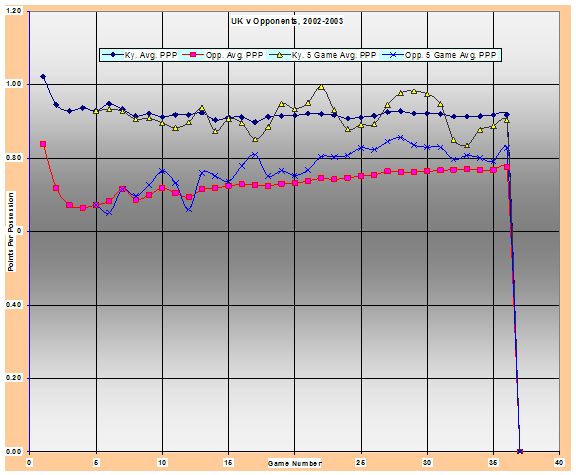
To See similar graphical presentations for 1996,
and 2000 through 2004
Click Here
Poor Kentucky Defense Tells Story For 2004-05
By J. Richard Cheeks
The Professor
Five games into the 2004-05 season, Kentucky 's offensive efficiency settled into its basic position for the entire season. As this graph illustrates, the average Offensive Efficiency after 5 games 0.93 points per possession, and at season's end, the average offensive efficiency stood at 0.92 ppp. As the Yellow, Five-game moving average illustrates, Kentucky enjoyed certain periods of better than average offensive efficiency and similar periods of lower than average performance for spans of 2 to 5 consecutive games. As the game-to-game performances either fell short of or exceed the average, the average would track eitherdown or up in marginal ways. Between the fifth and last games, the average offensive efficiency peaked at 0.95 following the Tennessee Tech game and bottomed at 0.90 points per possession following the game at Mississippi .
Kentucky 's defensive performance during the 2004-05 season demonstrates a significantly different pattern. At game 5, Kentucky has established an average defensive efficiency of 0.67 ppp, a truly outstanding value. If Kentucky could maintain that early season level of defensive play, as it did with its offensive play, then Kentucky would establish a Net Game Efficiency for the Season of about 0.26 ppp. A Net Game Efficiency above 0.25 ppp is sufficient to contend for the National Championship. However, the 0.67 ppp defensive efficiency after five games would be the low water mark for the 2004-05 Cats at the defensive end.
After game 5, Kentucky 's defensive efficiency steadily climbed to a season ending, and season high 0.775 ppp. All the while, Kentucky 's defensive play was also characterized by periods of 2 to 5 consecutive games that saw Kentucky play weaker and stronger defensively. As noted above, the offensive game-to-game data shares this pattern. However, unlike the offensive variations that occurred equally above and below the early season average, nearly all of the five-game moving defensive averages are above the average defensive efficiency after game 5 of the season.
Commentators have been eager to point out that Kentucky 's non-conference schedule for 2004-05 was significantly weaker than usual. However, conference play coupled with the usual regular opponents like Louisville , UNC, and Kansas means that the deeper this Kentucky team played into its season, the tougher the schedule, and the average strength of schedule would become. By the end of the season, Kentucky 's Strength of Schedule was 0.5684, #11, which is in fact at the low end, but within the performances of recent years [0.5995, #2 in 2004; 0.5774, #1 in 2003; 0.5993, #12 in 2002; 0.5961, #10 in 2001; and 0.6170, #4 in 2000] and the average SOS for the previous five seasons was 0.5985, #6. Given the similarity of the final schedule strength values in 2005 as compared to the preceding 5 seasons leads me to conclude that schedule strength was not the factor that many anticipated in November and December when the Cats hosted several of the weak sisters of the NCAA at Rupp, and on neutral courts.
Based on these results, I reach the following conclusions about the 2004-05 season.
- As the quality of Kentucky 's opponents increased from early January and beyond, Kentucky 's offense improved to meet the challenge, at least to the levels they established during their first 5 games. Since the strength of the opposition clearly increased in January through March as compared to November and December, this means Kentucky 's raw offensive effectiveness had to improve to meet the increasing challenges.
- As the quality of Kentucky 's opponents increased from early January and beyond, Kentucky 's defense did not improve to meet the rising challenge. To be sure, Kentucky 's defense failed to keep pace with the increasing talent of its opponents. However, it is not possible to determine whether the defensive play declined, increased at a slow pace, or remained static over the season.
- Kentucky 's disappointing finish is due primarily to declining defensive play rather than inadequate or declining offensive play.
The deeper Kentucky moved into the NCAA Tournament, the opponents exploited Kentucky 's defensive laxity, culminating with the loss due to defensive failures to Michigan State in the Elite Eight. The following Table shows the game offensive and defensive efficiencies for the four NCAA games.
NCAA 05 Performance
Kentucky
OPPONENT |
Off Eff |
Def Eff |
EKSU |
0.9231 |
0.7901 |
Cincinnati |
0.9452 |
0.7143 |
Utah |
1.0000 |
0.7761 |
Michigan State |
0.9670 |
1.0217 |
Can Kentucky improve its overall offensive performance? Certainly, once one understands that the average offensive performance among NCAA teams is about 0.83 ppp, Kentucky 's 0.92 is 75% of the span between the average and the reasonable goal of 0.95 or more for offense. On defense, Kentucky 's season ending 0.78 ppp is only about 38% of the way from the NCAA average and the goal of 0.7 ppp or lower for championship caliber play.
It will not be sufficient for Kentucky to only increase its offensive performance to 0.95 or higher offensive efficiency. Kentucky must also improve its average defense to 0.70 ppp or less to seriously compete for national championships.
Click Here To Return to the Data Index
Copyright 2005 Richard Cheeks
All Rights Reserved
Copyright 2005 Richard Cheeks
All Rights Reserved